Global democratic backsliding seems real, even if it is hard to measure
Our analysis highlights two measures of governance that have diverged in recent years

Global democracy indices, 2008=100
102
Objective indicators,
Little & Meng, 2023
100
The Economist indices
State capacity
98
96
EIU
↓ Less democratic
Political liberalism
Electoral
democracy, V-Dem
94
Freedom House
92
2008
10
12
14
16
18
20
22
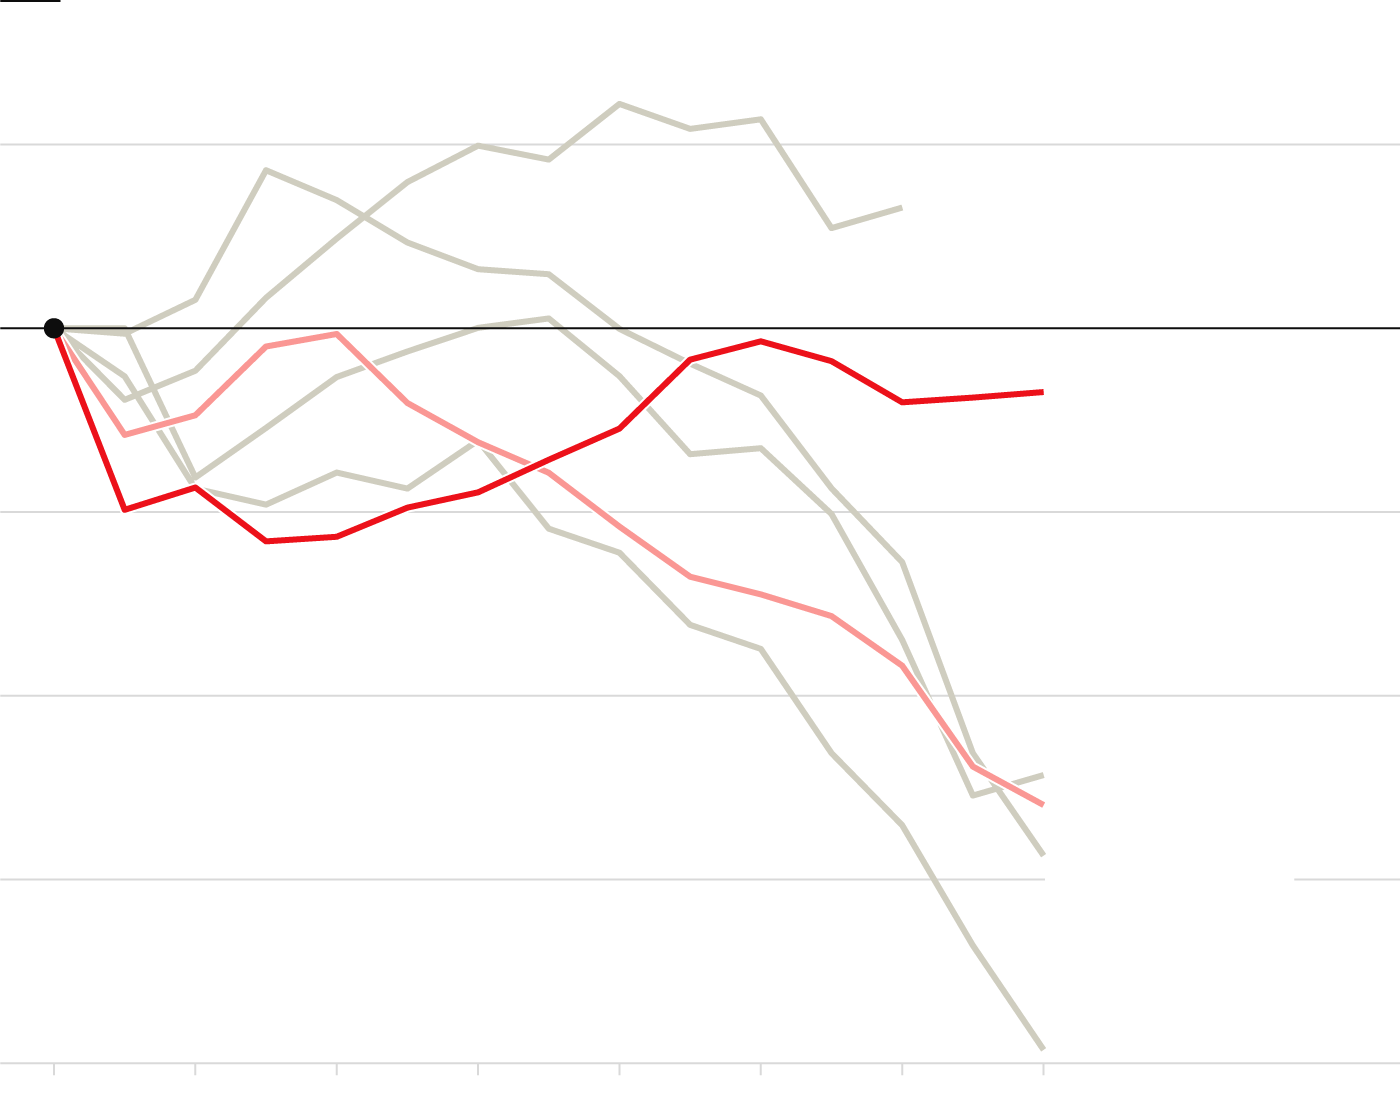
Since the early 2010s political scientists have become increasingly glum about the health of the world’s democracies. The term “democratic backsliding”—used to describe the decline of political competition or civil rights in places as diverse as America, Brazil, Hungary, the Philippines, Tunisia and Turkey—appeared in books 6.4 times more often in 2019 than in 2010, according to Google NGram, a database. Scholars now refer to a “third wave of autocratisation”, partly reversing a surge of democratisation following the cold war.
To support these claims, analysts usually turn to annual quantitative scores of countries’ democratic vigour. These widely cited indices, published by think-tanks like Freedom House and V-Dem and also by our sister organisation, the Economist Intelligence Unit (eiu), have been falling on average since the early 2010s. Their scores largely rely on experts’ subjective opinions about the strength of different aspects of democracy, such as the fairness of an election rated on a five-point scale.
This year, however, these indices have come under renewed scrutiny. Some say they reflect the political preferences of their authors rather than real changes in how countries are governed. A new study, by Andrew Little of the University of California, Berkeley and Anne Meng of the University of Virginia, found that during the recent period of purported backsliding, countries’ marks on objective measures, such as whether the ruling party had violated term limits or the number of journalists killed, had barely changed in aggregate.
In an effort to arbitrate between these competing conclusions and identify which, if any, aspects of democracy have been in decline, The Economist developed our own composite measures, using a statistical method that minimises the impact of human bias. This approach identified two key aspects of governance—one broadly aligning with state capacity, the other with aspects of liberalism, openness and competition—whose fates have diverged over the past 15 years. Our results suggest that standards of democracy probably have regressed since 2008, even if they are hard to measure objectively.
We used a statistical tool called Bayesian factor analysis to combine variables that follow similar trajectories. It condensed the 279 indicators used in the V-Dem and EIU indices into two separate scores for each year in each of the 178 countries for which data was available.
The first of these scores broadly corresponds to traits related to liberalism, openness, distribution of power and political culture.
The other assesses states’ capacity to maintain order, provide public services and manage the economy.
Countries that fare well on the liberalism index tend to have a relatively free and impartial press, an independent judiciary and robust civil liberties.
Countries that fare well on state capacity tend to be rich and well governed, though not necessarily democratic.
Since 2008 individual countries have shown every possible combination of changes on the two scores.
For a few countries, things have got comprehensively better by both measures. In Malaysia, for example, after a corruption scandal the opposition took power for the first time in 2018.
In many more countries, scores on both state capacity and liberalism have fallen. For some, like Denmark, these are small changes, but others, like Venezuela, have seen a catastrophic collapse.
The two scores don’t always track one another. In a handful of countries liberalism rose even as state capacity fell. In Libya for example, Muammar Qaddafi's dictatorship gave way to an elected government in 2014—but also to a prolonged civil war.
But for a plurality of countries, the opposite happened: state capacity rose even as openness fell. Some such places, like Hong Kong or Russia, have seen political liberalism fall dramatically.
You can select a country to see how its score on both measures has changed over the past 15 years.
To create our indices we first compiled a dataset of every component measure, both subjective and objective, that contribute to the V-Dem and eiu indices. The data spanned from 2008 to 2022 and covered topics ranging from voter turnout to women’s rights to the relative power of the executive and legislative branches.
Creating indices, whether of democracy or anything else, requires somewhat arbitrary choices about which variables to include, and how they should be weighted. By using Bayesian factor analysis, we could avoid some of the inherent subjectivity in such decisions. The method grouped and combined variables that follow similar trajectories, producing two separate scores for each country in each year.
These scores emerged organically from the data, without any human guidance on how measures should be grouped. As a result, they produce some oddities at the level of individual countries. Some small Latin American and Caribbean countries, like the Dominican Republic, get unusually high ratings for openness, and South-East Asian ones such as Vietnam and Laos score surprisingly well on state capacity.
But in aggregate, countries that elect their leaders fare much better than dictatorships on the index tracking political institutions, and rich countries almost always get better state-capacity scores than poor ones do. European countries, America, Canada and Japan rank above average on both indices; Afghanistan, Syria and Myanmar linger near the bottom.
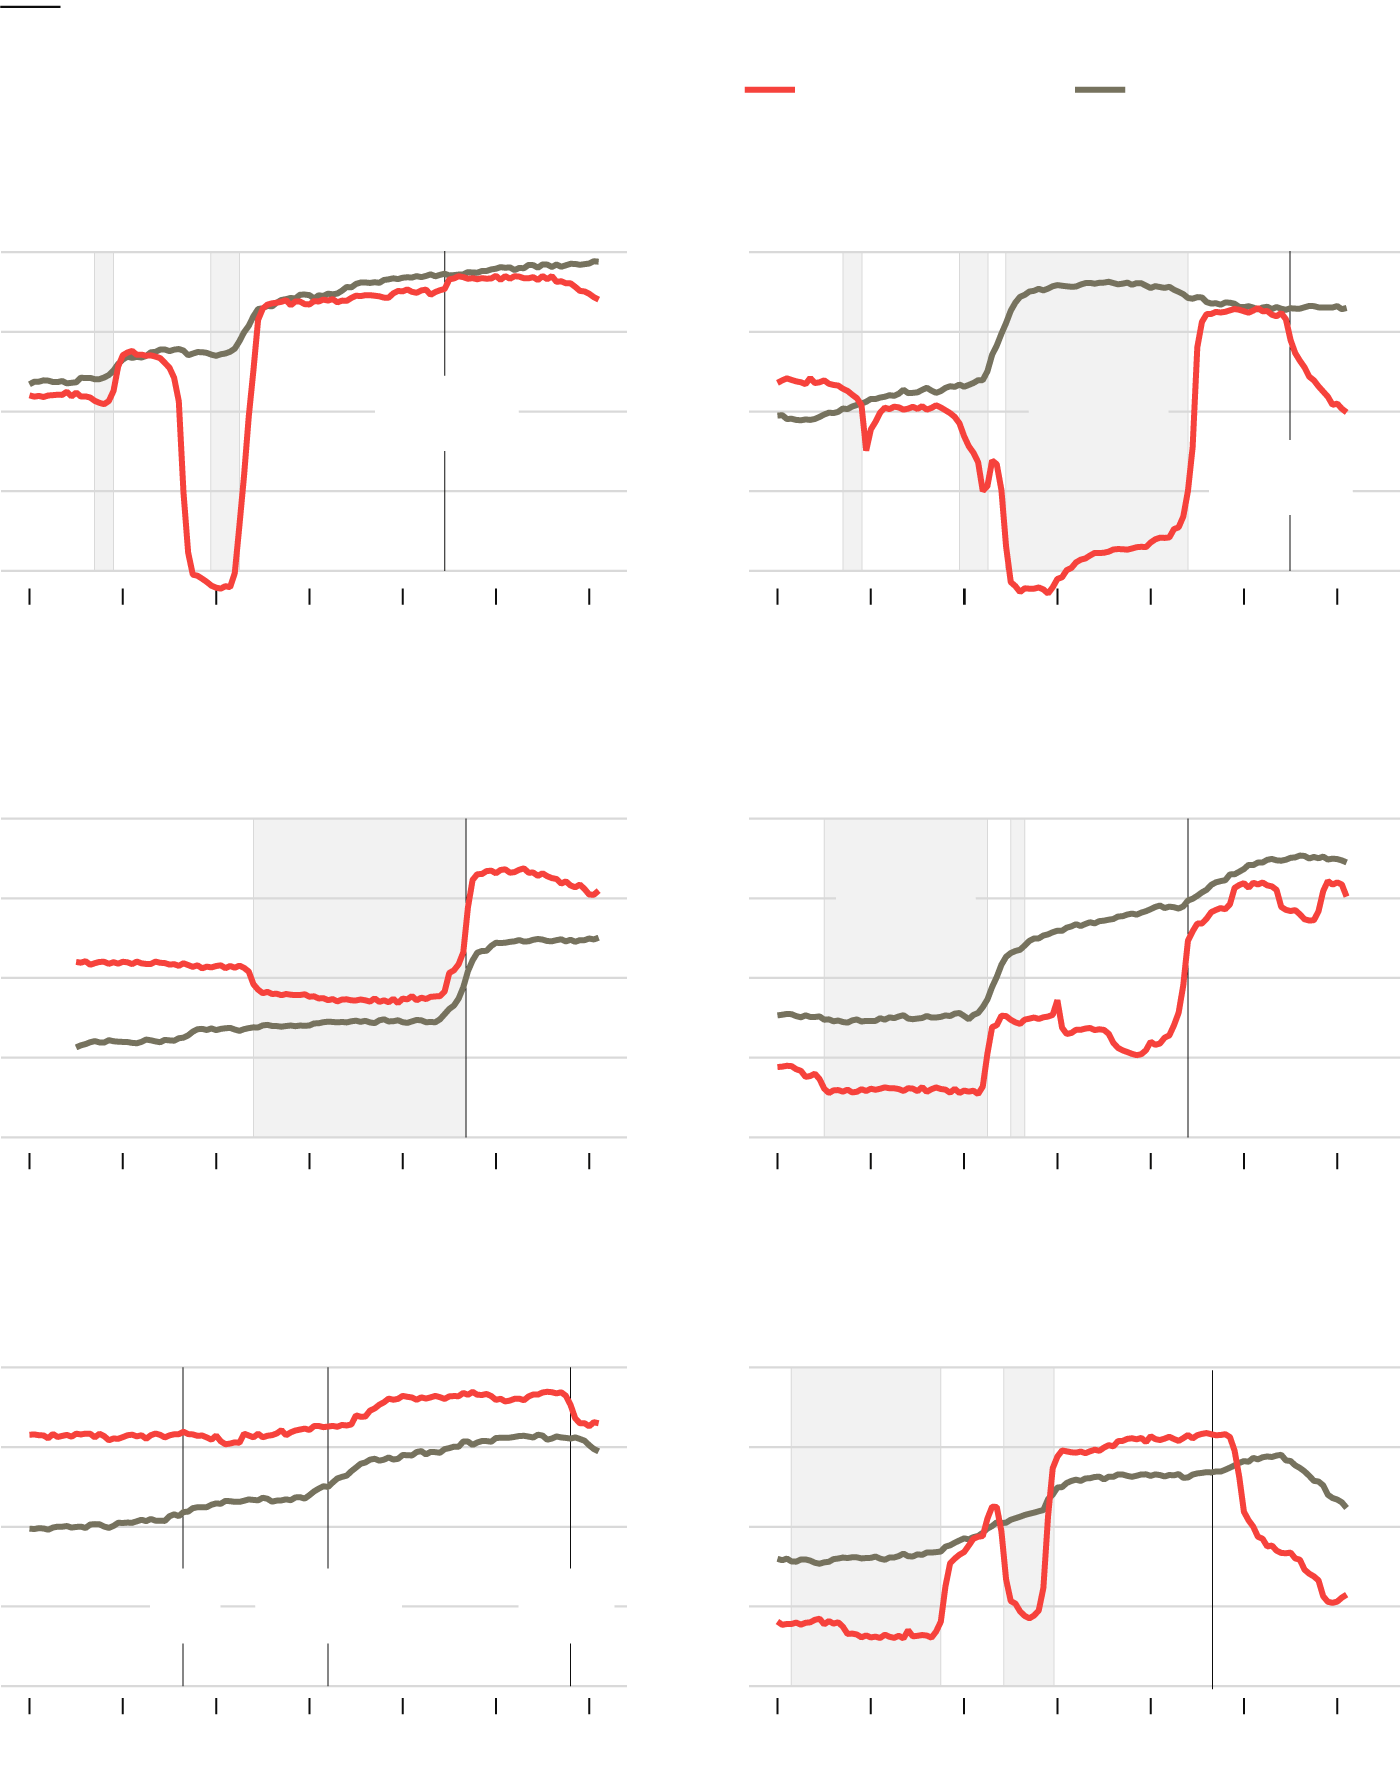
Globally, the two scores have evolved very differently during the past decade. Whereas the openness dimension has, on average, declined since 2008, the state-capacity dimension has remained largely stable. Only a handful of countries saw improvements in both measures, but liberalism fell while state capacity rose in 67 of the 178 jurisdictions with available data, including China, Hong Kong and Hungary.
As well as highlighting a decline in global liberalism, our results also provide an explanation for the disagreement among trackers of democracy. Our scores broadly align with the distinction between objective and subjective criteria. On average, the component scores that are quantified by human coders get weighted more heavily on the political dimension. In contrast, those that can be measured empirically count more for the state-capacity dimension, which tends to track GDP per person.
As a result, rather than human coders identifying backsliding in areas where objective data show no such decline, they may instead be finding erosion in areas for which few objective measures exist. Take Hungary, for example. Based on objective measures alone, Hungary’s democracy seems to be in rude health: elections are contested, journalists rarely face arrest and GDP per person is up since 2008. But last year a majority of members of the European Parliament declared that the country had become an electoral autocracy, citing corruption and a lack of media pluralism or an independent judiciary. Our figures capture both little change in state capacity and a dramatic fall in liberalism since 2008.

Two components
The Economist’s democracy index
100=highest country value (Denmark in 2022)
Political liberalism
State capacity
Germany
Hungary
100
WW1
WW2
WW1
WW2
80
Communist
rule
Berlin wall
falls
60
Orban
elected
40
20
1900
20
40
60
80
2000
20
1900
20
40
60
80
2000
20
South Africa
South Korea
Mandela elected
First free elections
100
Occupied
by Japan
Korean War
80
Apartheid
60
40
20
1900
20
40
60
80
2000
20
1900
20
40
60
80
2000
20
United States
Venezuela
Chávez elected
100
Dictatorship
Dictatorship
80
60
New
Deal
Civil Rights
Act
Trump
elected
40
20
1900
20
40
60
80
2000
20
1900
20
40
60
80
2000
20
Though our method eliminates one source of bias in index-making—the combination of variables—it cannot tackle partiality in the underlying subjective scores. There are no right answers to questions like whether the media give “exaggerated” amounts of coverage to the governing party. Given such ambiguity, the more that human coders look out for democratic backsliding, the more likely they may be to find it. Devising objective measures of fuzzy concepts like the fairness of elections might help. Then again, autocratic regimes might also find ways to game supposedly objective measures of fairness.
For now it appears that, although states may be functioning as well as ever, liberal values are ailing. Until recently the two aspects of governance tended to move together. Their new decoupling looks durable.■
Sources: Economist Intelligence Unit; Freedom House; Little & Meng 2023; V-Dem Institute; The Economist


